The Council of State Governments (CSG) Elections Research Group tracked all 83 races for statewide and territorial executive branch positions during the 2020 election cycle: Governor (13), Lieutenant Governor (10), Attorney General (10), Auditor (9), Secretary of State (7), Treasurer (9) and statewide commissions (25).
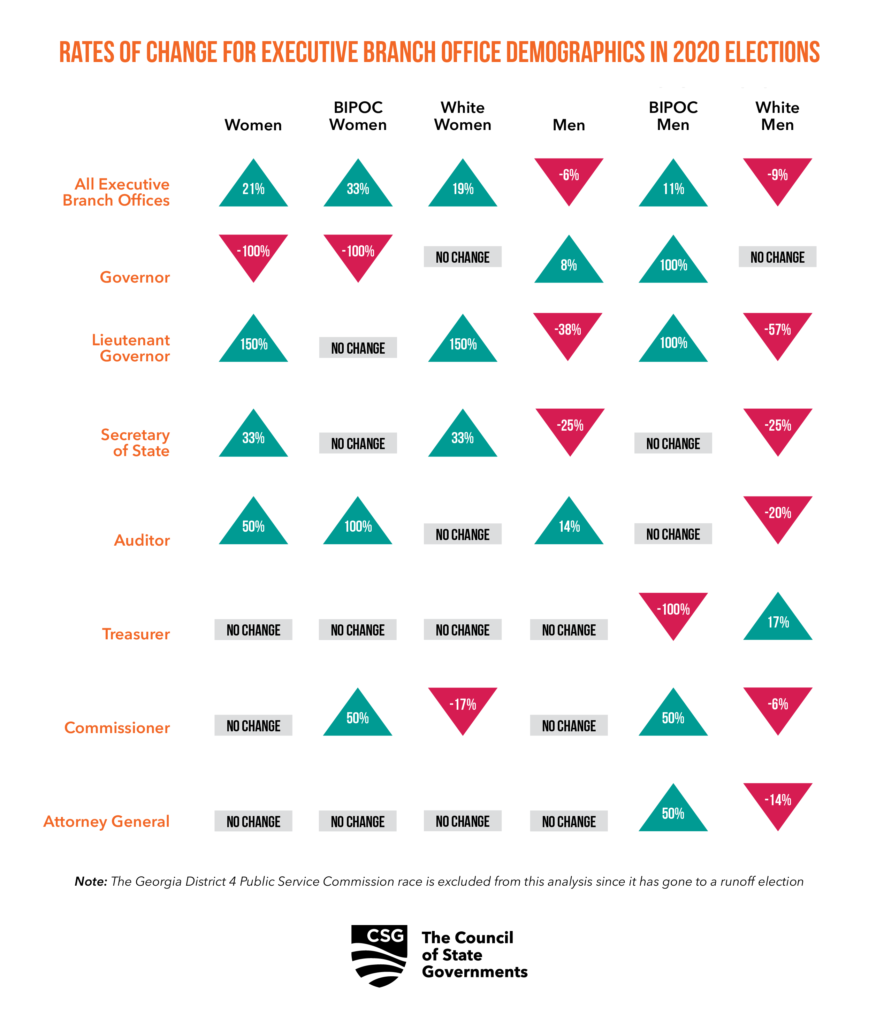
Across statewide offices up for election in 2020, there will be an increase in Black, Indigenous and People of Color (BIPOC) women, BIPOC men, and White women who will hold these positions once installed. There will be a 33% increase in the number of BIPOC women in these offices; an 11% increase in BIPOC men and a 19% increase of White Women.
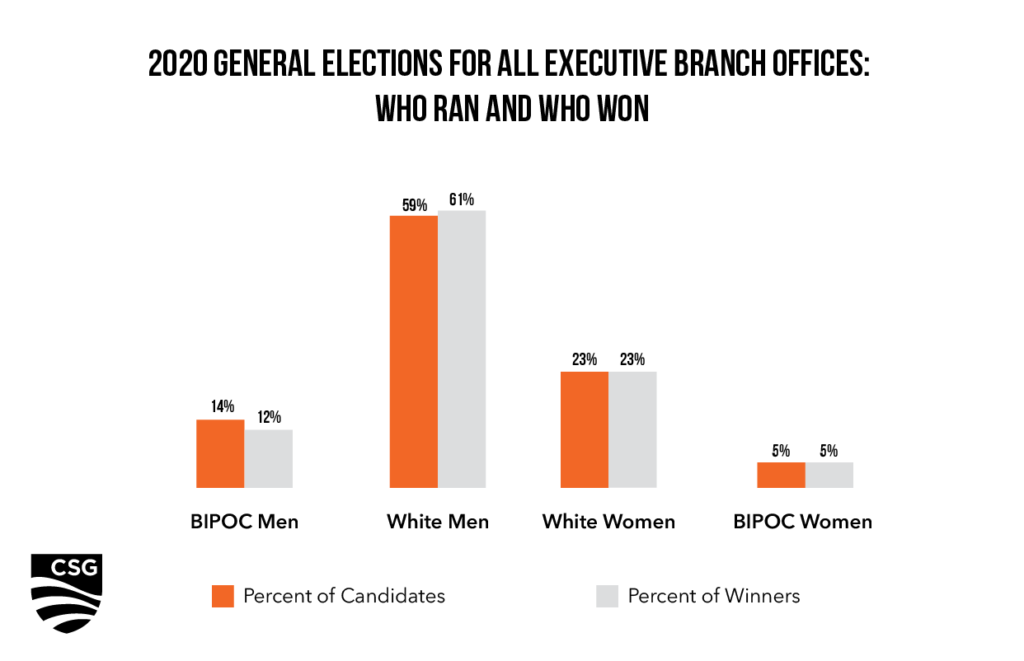
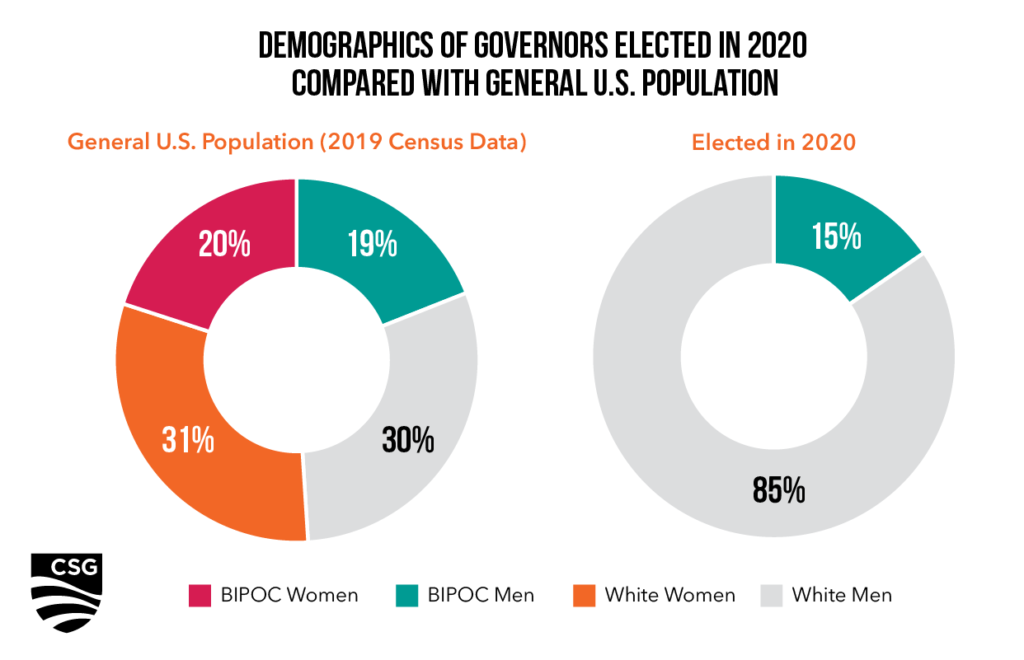
Despite this increase in representation of women and BIPOC men, these groups are still underrepresented compared to the general U.S. population. According to 2019 General U.S. Population Census data, white men make up 30% of the U.S. population and white women make up 31% of the U.S. population. In 2020 executive office elections white men were elected to 61% of the positions, with white women winning 23% of the elections. BIPOC men make up 19% of the U.S. population, but only accounted for 12% of the election wins this year. BIPOC women account for 20% of the U.S. population, but only accounted for 5% of executive office election wins in 2020.

Election tracking analysis methodology
This analysis is built on a dataset of candidates and winners of 2020 general elections for executive branch positions aggregated by CSG researchers from existing research and public information. Candidate race and gender information was collected through candidate self-identification in third-party-administered interviews and surveys or candidate personal statements. For the purposes of this analysis, only gender and race categories that candidates self-identify are included.
To compare the demographics of candidates and winners, CSG researchers calculated the percentage of candidates compared to winners in each race and gender category. To compare the demographics of winners with the U.S. population, 2019 census data for each race and gender category was used.
The rate of change for executive branch office demographics for the 2020 general election also was calculated, dividing the difference between the number of incumbents and 2020 winners in each race and gender category by the number of pre-election holders of these offices in each race and gender category.
Governor
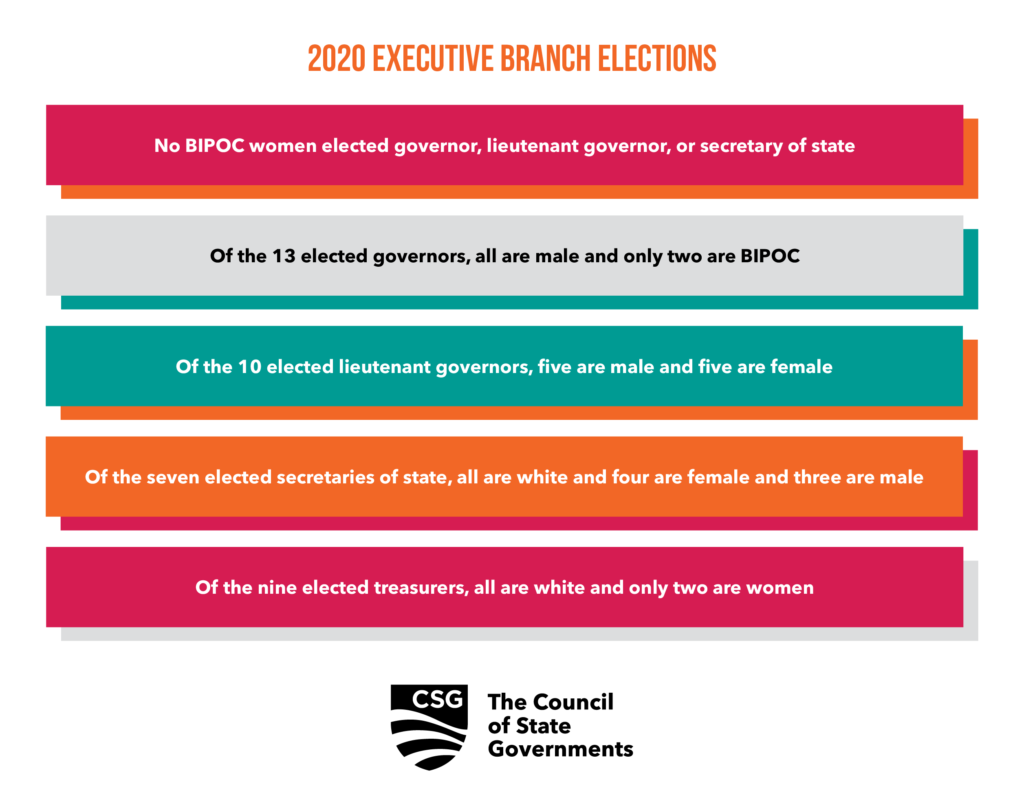
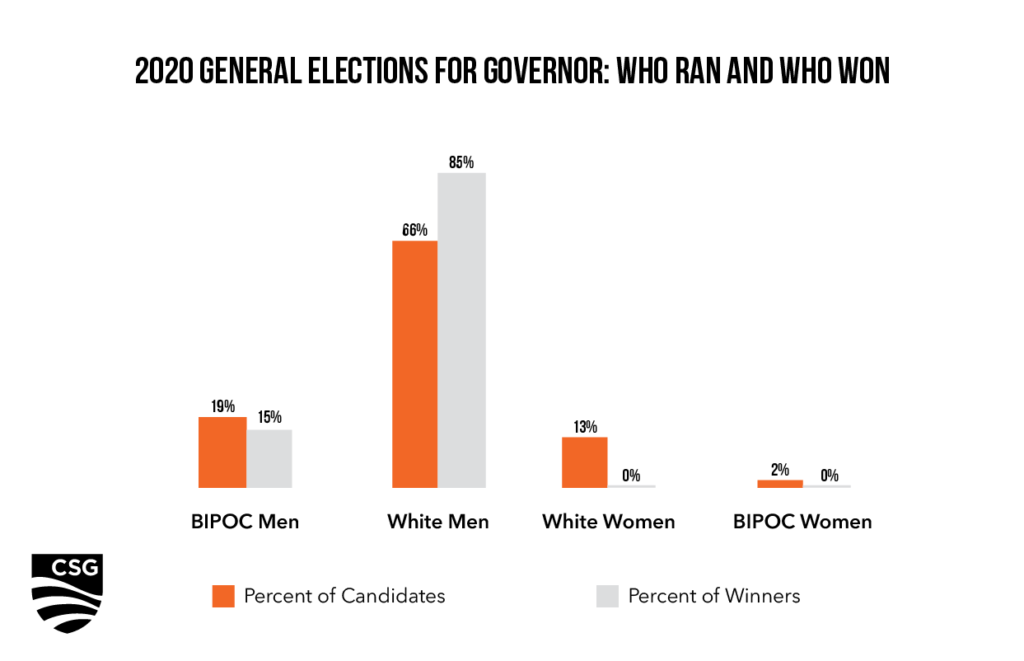
During the 2020 election cycle, CSG researchers tracked 13 elections for Governor involving 53 candidates. Approximately 85% of those ultimately elected are white males despite constituting only 30% of the U.S. population. In contrast, the percent of BIPOC men elected Governor in 2020 more closely aligned with their representation in the overall population. In 2019, BIPOC men constituted 19% of the overall population and won 15% of the gubernatorial races in 2020. There will be a decrease in the number of women occupying the Governor’s office, with one BIPOC woman having left office and no women having won election.
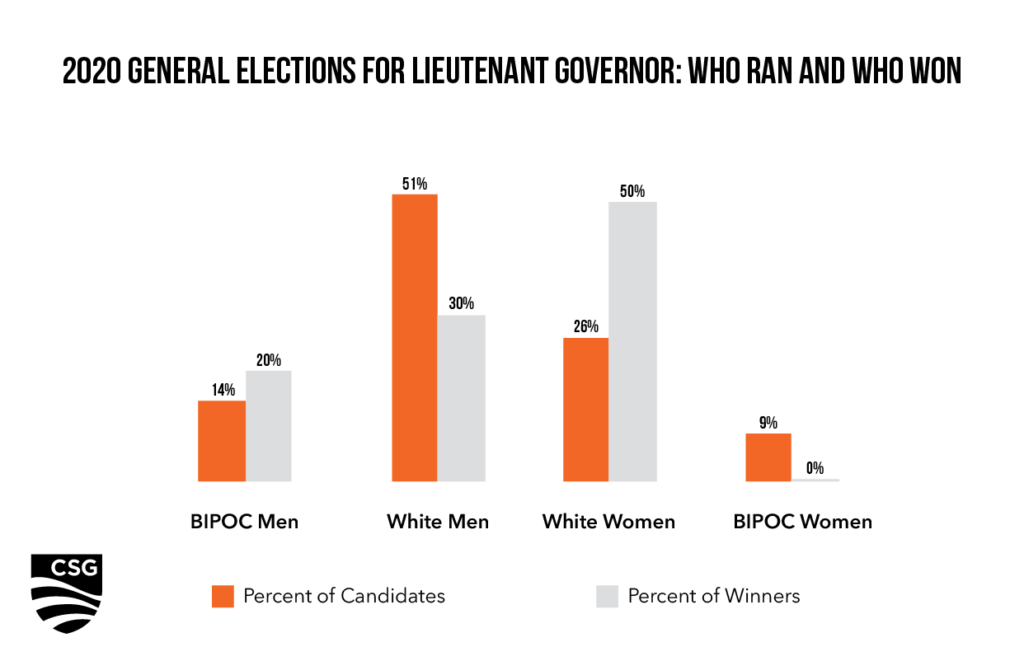
Lieutenant Governor
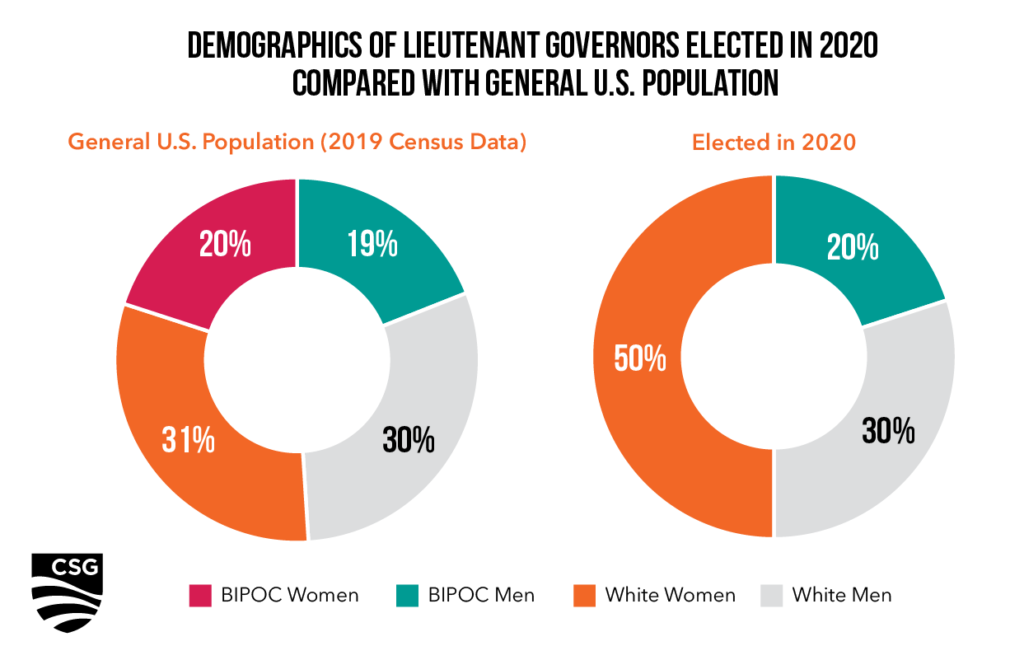
Although women were underrepresented in 2020 campaigns for Lieutenant Governor, they won half the 10 races – resulting in a 150% increase in the number of white women in these positions in these states (when compared to the demographics of previous seat holders). None of the three BIPOC women who ran for Lieutenant Governor in 2020 won. The number of white and BIPOC men elected to these positions are reflective of their representation in the overall population, with approximately 30% of winning candidates being white men and 20% being BIPOC men.
Attorney General
The candidate pool for Attorneys General in 2020 exhibited the least demographic diversity compared to all other executive branch races. Eighty percent of winning candidates are white men. There were only two winning candidates of a differing demographic background – one BIPOC man and one white woman. This translates into a 50% increase in the number of BIPOC men who will occupy the available positions of Attorney General in 2021. BIPOC women were once again among the least represented, with no one of this demographic having run for this office in 2020.
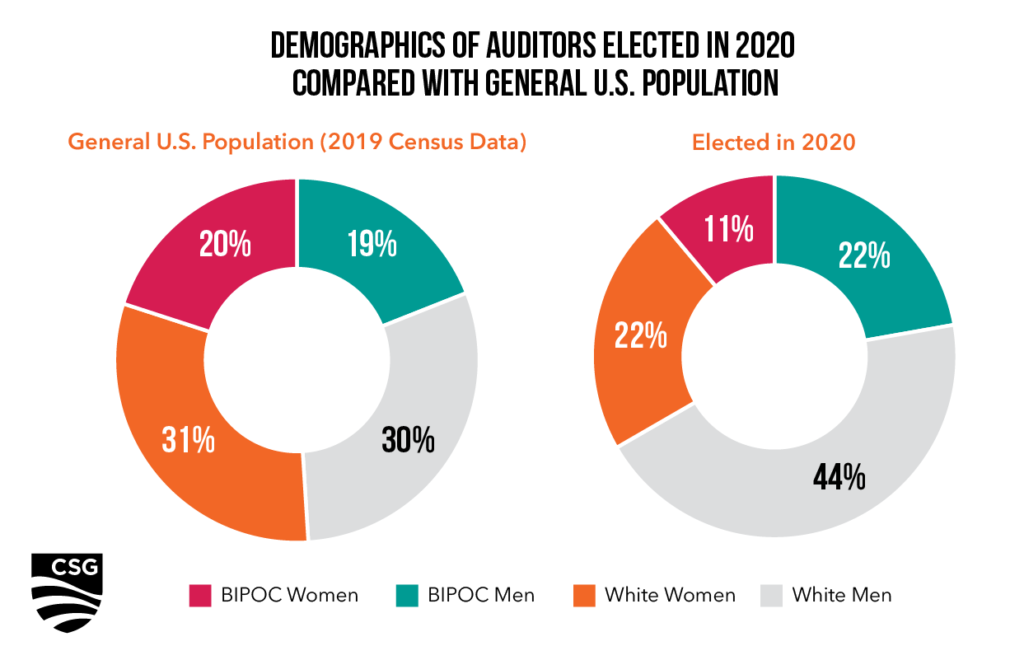
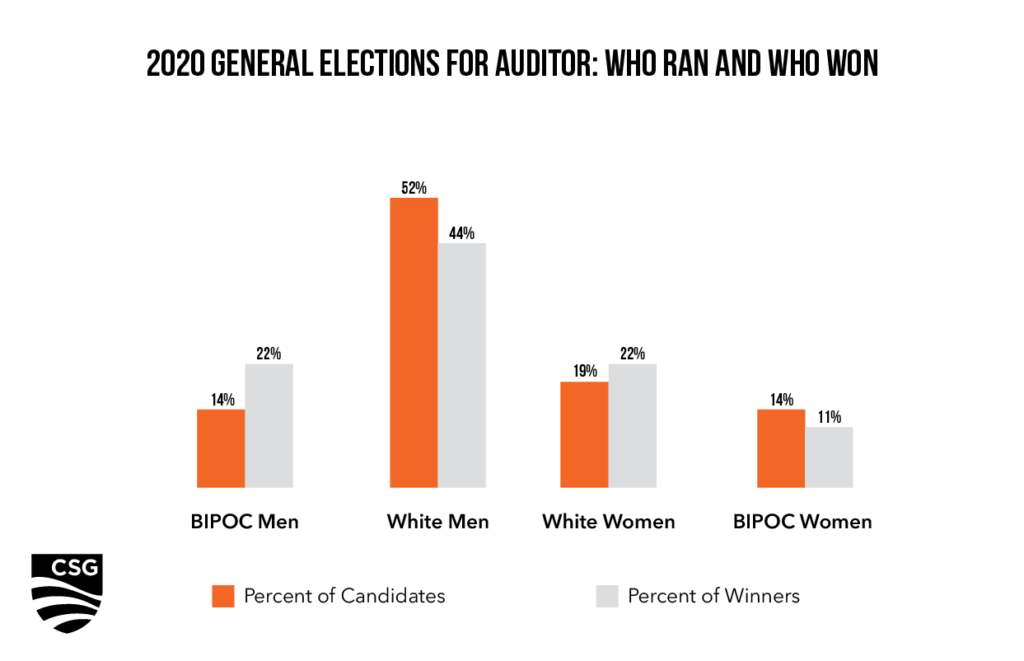
Auditor
Of the 2020 executive branch elections, the nine races for Auditor were among the most demographically diverse. Approximately 11% of winning candidates are BIPOC women, 22% are white women, 22% are BIPOC men and 44% are white men. This translates into a 50% increase in the number of women elected Auditor. When compared to the demographics of previous seat holders, the number of white men occupying these positions will decrease 20%. According to 2019 U.S. census data, however, white men will remain overrepresented in these positions compared to their proportion of the total population.
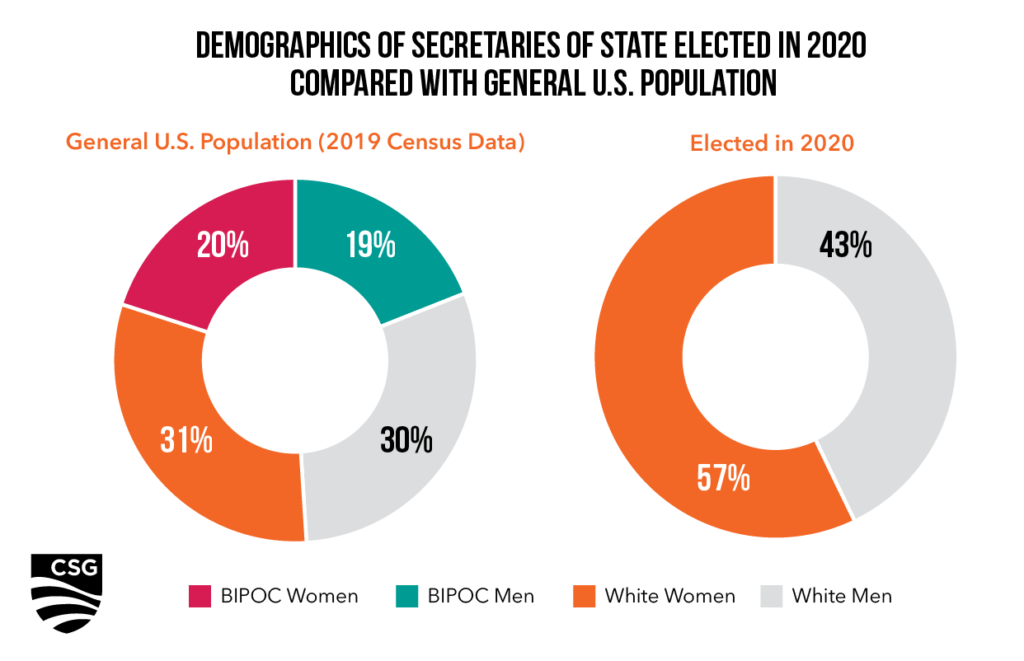
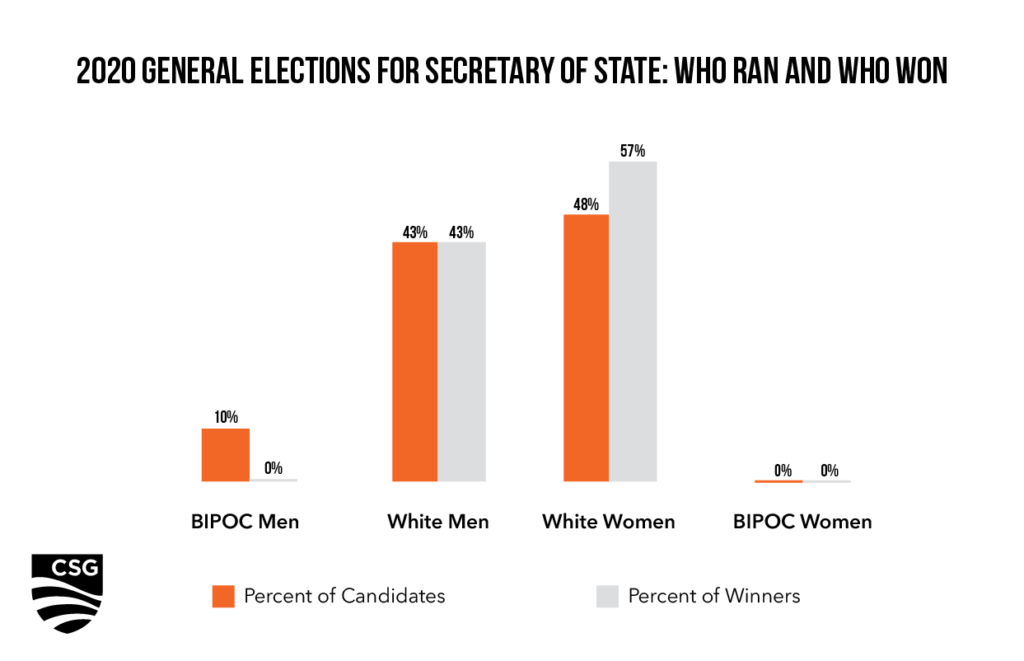
Secretary of State
As with other executive branch races in 2020, BIPOC women remain underrepresented among winning candidates. Despite constituting 20% of the population, no BIPOC women ran for Secretary of State. Two BIPOC men ran for Secretary of State during this election cycle, but neither won. In contrast, 43% of winning candidates are white men – though this constituted a 25% decrease in the number of men holding this office. This marked decline can be attributed to a 33% increase in the number of white women elected to this position.
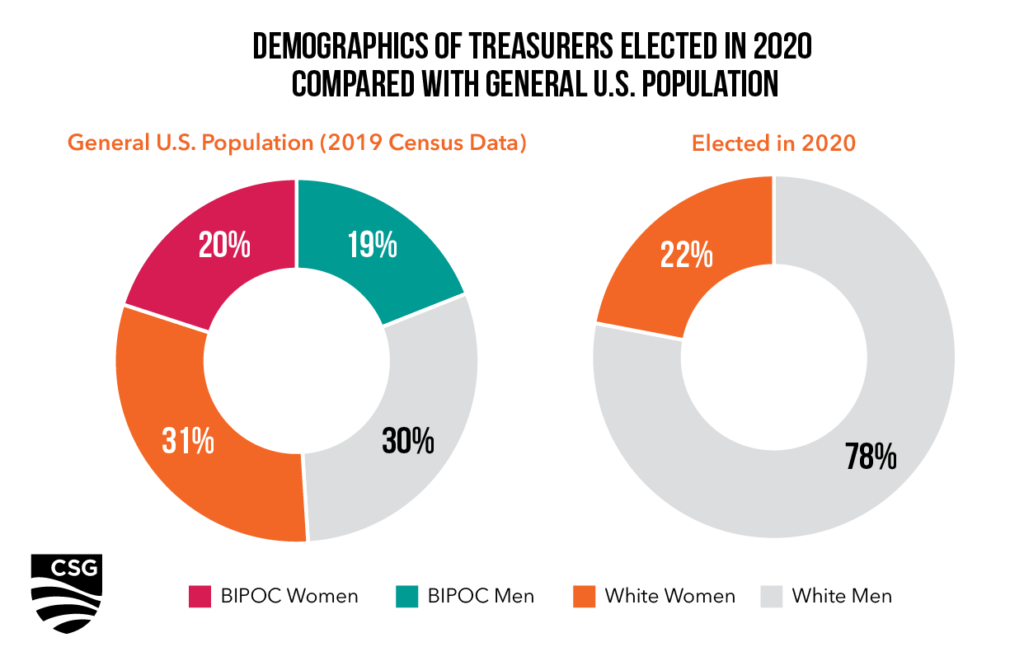
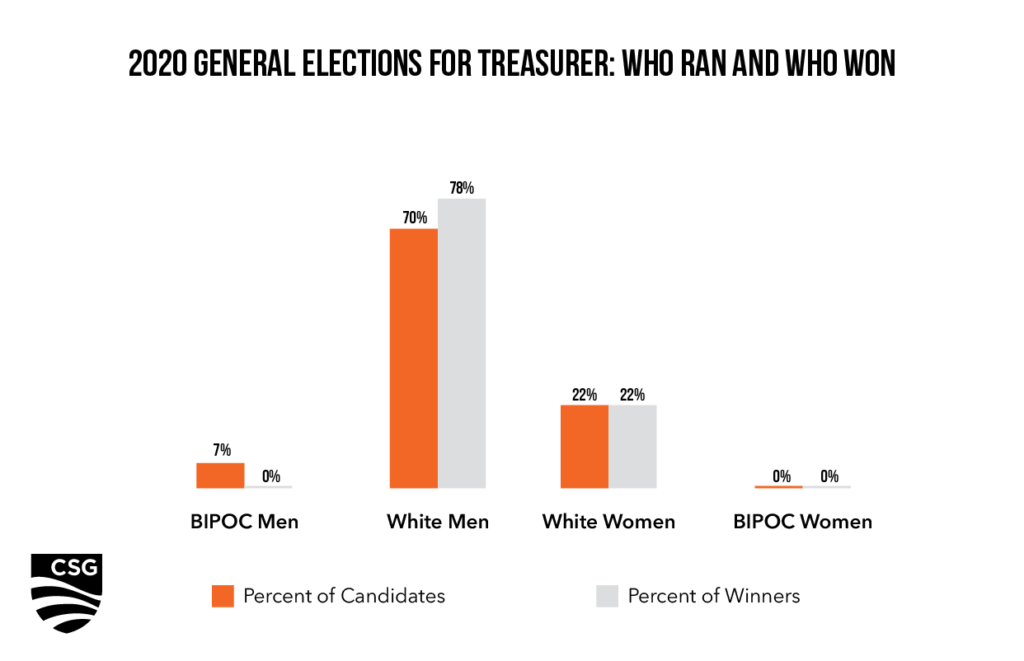
Treasurer
In 2020, two BIPOC men and no BIPOC women ran for Treasurer, but neither BIPOC man won. In fact, the one BIPOC man up for re-election lost his bid to return to office. White men are the only demographic group to increase the number of positions held – approximately 17%.
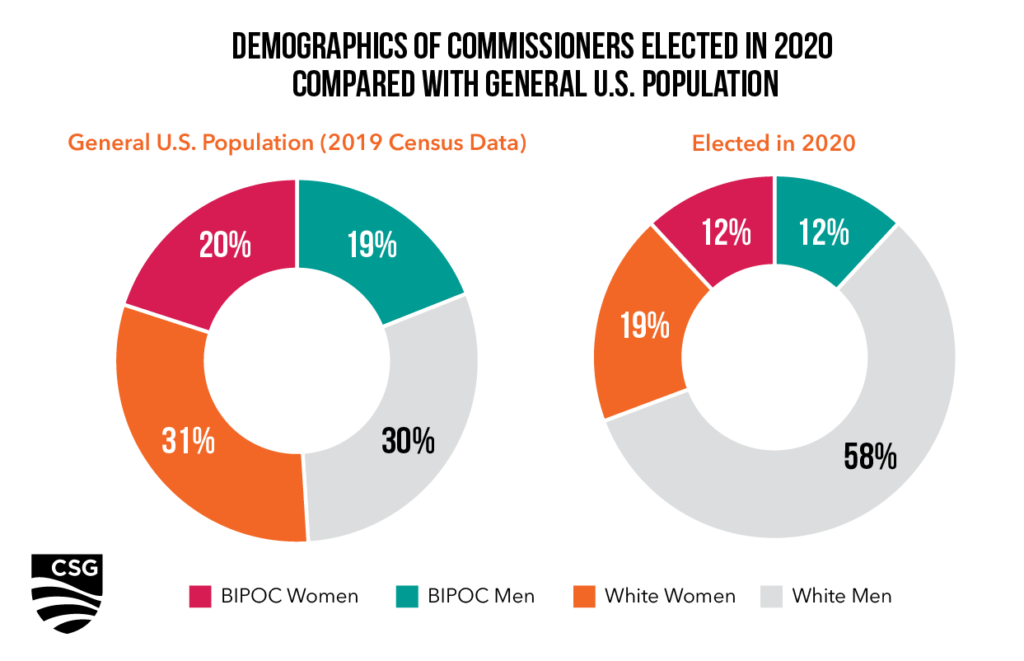
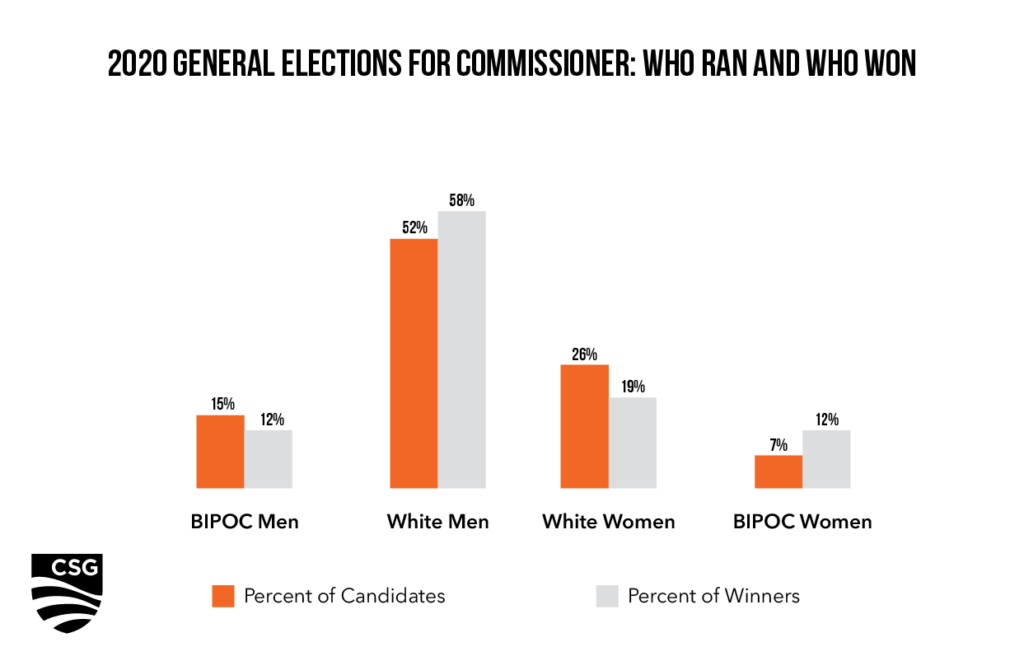
Commissioner
In 2020, there were 25 elections for Commissioner. White men are significantly overrepresented among the elected Commissioners, accounting for over half of those elected. White women accounted for approximately 19% of elected commissioners and BIPOC men accounted for approximately 12% of elected commissioners. Four BIPOC women won their race for Commissioner, constituting a 50% increase in the number of BIPOC women who will be in these positions. This gain has closed the gap between the proportion of BIPOC women serving as Commissioner and their overall representation in the total U.S. population. However, this gap remains at approximately eight percentage points.